Description
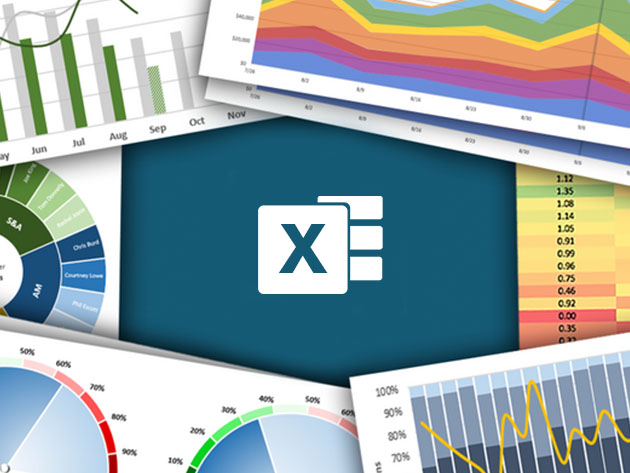
Ask people what comes to mind when they think of Excel and odds are they’ll say, “spreadsheets”. However, Excel is an incredibly powerful, robust, and dynamic data visualization platform. This course will give you a deep, comprehensive understanding of Excel’s latest data visualization tools and techniques. You’ll learn when, why, and how to use each chart type, discover key data visualization best practices, and learn through interactive, hands-on demos and exercises every step of the way.
- Access 49 lectures & 4.5 hours of content 24/7
- Explore each of the 20+ chart types that Excel 2016 has to offer
- Dive into a series of 12+ advanced Excel demos guaranteed to turn you into a data visualization pro


Reviews for Microsoft Excel: Data Visualization, Excel Charts & Graphs
Click Here to Read Reviews for Microsoft Excel: Data Visualization, Excel Charts & Graphs >> Click Here to Submit Reviews for Microsoft Excel: Data Visualization, Excel Charts & Graphs >>