Real-time spectrogram has full 22 KHz spectral bandwidth. No advertisements.
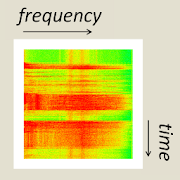
The output is a display in the form of an image called a waterfall plot that represents the frequency spectrum of the audio as it changes in time. Intensity may be plotted on a rainbow or gray scale. Red represents a strong signal, blue a weak signal.
Options are available via the Android Menu key. The user may toggle a grid to overlay the spectrogram. The spacing between vertical lines is 2000 Hz.
This spectrograph collects 1024 samples at a sampling rate of 44,100 Hertz every 150 milliseconds. Each collection of 1024 samples corresponds to a single horizontal line in the display as shown in the actual screenshots. A moving set of gridlines is added just ahead of the most recent horizontal line of data so the user can measure frequency. These lines are 2 KHz apart.
The feature graphic on the Android Marketplace shows the “sound prints” of various activities, including those of cricket chirping. The phone itself seems to introduce an noise into the spectrum around 10 and 12 KHz, as well as thin lines at 7,200 and 14,400 Hertz.
Have fun looking at the “sound prints” of ordinary things. To learn more about frequency spectra see the one-page tutorial on our website, https://sites.google.com/a/andwaves.com/www/home/about-fourier-transforms
Reviews for Spectrogram
Click Here to Read Reviews for Spectrogram >> Click Here to Submit Reviews for Spectrogram >>